United Nations Conference on Trade & Development (UNCTAD) releases every year an annual report with the aim of fostering the transparency of maritime markets and analysing relevant developments. This post refers to “The Review of Maritime Transport” for 2012 which covers data and events from January 2011 until June 2012. In this post we present an extract from the UNCTAD 2012 report regarding seaboarne trade by cargo type.
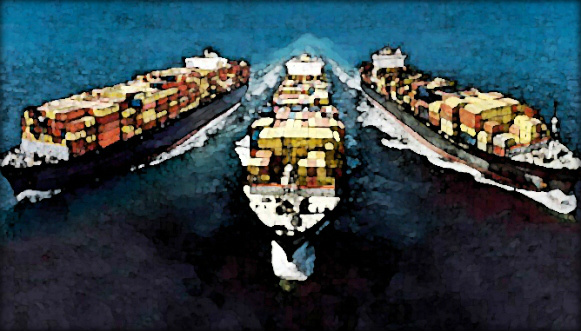
In connection with developments in the world economy and global merchandise trade, international seaborne shipments continued to grow in 2011, albeit at a slower rate than in 2010. Fueled by strong growth in container and dry bulk trades, world seaborne trade grew by 4 per cent in 2011, taking the total volume of goods loaded worldwide to 8.7 billion tons. In addition to the sovereign debt crisis in Europe and other difficulties facing advanced economies a number of factors have weighed down on global growth. These include heightened global financial risks, political and social unrest in North Africa and Western Asia, natural disasters in Japan and Thailand which have disrupted regional and global supply chains, rising oil prices and volatility, the impact of the austerity measures introduced in many countries and the fading of the stimulus effect of 2010, and growing geopolitical tensions. Many of these factors have remained relevant in 2012 and, depending on how they evolve, may impact dramatically on the global economic and trade outlook and international seaborne trade.
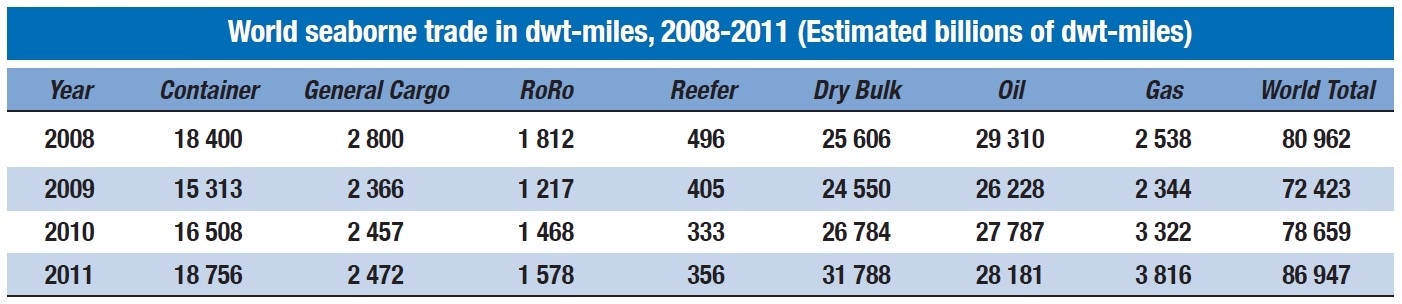
Source: Lloyd’s List Intelligence, 2012. http://www.lloydslistintelligence.com
Crude Oil Production and Consumption
In 2011, world oil consumption grew marginally by 0.7 per cent to reach 88 million barrels per day (bpd). While consumption in the OECD countries declined by 1.3 per cent, it rose by 2.8 per cent in developing countries. Interestingly, after growing by an average of 12 per cent annually between 2006 and 2010, oil consumption growth in China slowed down in 2011, reflecting, in particular, the effect of the country’s lighter monetary and fiscal policies.
Global production increased by 1.3 per cent to reach 83.6 million bpd in 2011, with members of the Organization of the Petroleum Exporting Countries (OPEC) leading the growth. Non-OPEC supply remained flat as growth in the United States, Canada, the Russian Federation and Colombia was offset by declines in Norway and the United Kingdom. An overview of major producers and consumers is presented in table 1 .6.
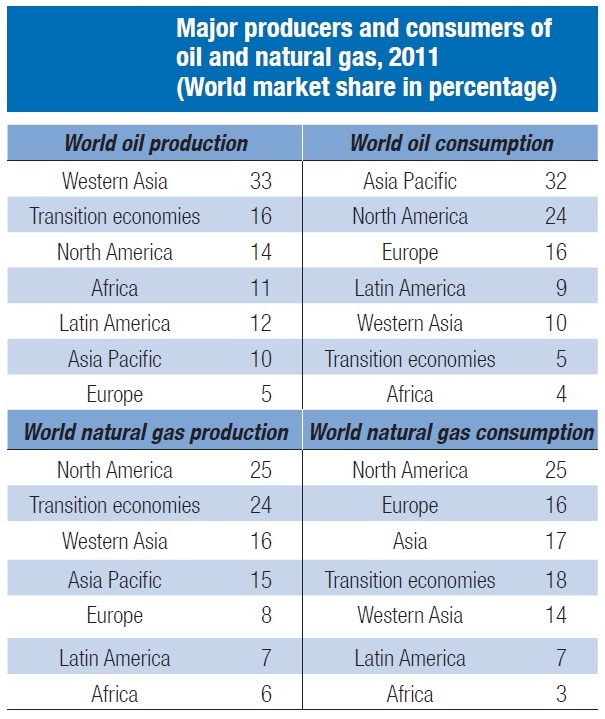
Source: UNCTAD secretariat on the basis of data published in the British Petroleum (BP) Statistical Review of World Energy 2012 (June 2012). Note: Oil includes crude Oil, shale oil, Oil sands and natural gas liquids NGLs – the liquid content of natural gas where this is recovered separatety. The term excludes liquid fuels from other sources as biomass and coal derivatives.
Recent developments in drilling activity point to future oil supply increases. Drilling activity picked up in 2011 due in part to the allocation of new drilling permits in the Gulf of Mexico. This follows the end, in October 2010, of the moratorium established in this region after the Deepwater Horizon incident. Activity also revived with the emergence of new exploration of fields in Brazil and the Gulf of Guinea (Ghana, Angola, Equatorial Guinea and the Congo) and with new projects being launched in 2011.
Crude Oil Shipments
Over the past decade, crude oil volumes increased at a relatively slower pace than other market segments. Between 2000 and 2011, crude oil shipments grew annually at an average rate of less than 1 per cent while in 2011 , they declined by 1.4 per cent. In 2011, the total volume of crude oil loaded globally amounted to about 1.8 billion tons. Western Asia remained the largest loading area, followed, Africa, developing America and the transition economies. Major importing areas were in ascending order, Japan, North America, Europe and developing Asia.
Tanker trade patterns are changing as crude oil source diversification continues. A new map of crude supplies is being drawn up as new oil discoveries are made in different regions and as new market suppliers emerge. Underpinning the diversification strategy is the active move by China to secure its energy supply through foreign investments. In March 2009, China lent up to $40 billion to the Russian Federation, Kazakhstan, the Bolivarian Republic of Venezuela and Brazil in exchange for oil, while its investment in the mining sector in sub-Saharan Africa accounted or about one third of the country’s foreign direct investment (FDI). There are now 50 countries in which Chinese oil companies have more than 200 upstream investments. The extent to which the international tanker market would benefit from the full opportunities arising from these projects remains unclear as the strategy being developed by China also aims to ensure that by 2015, half the country’s crude imports are shipped on domestic ship tonnage. Another trend reshaping the market is the falling demand in the United States – the world’s largest oil consumer – and the consequent reorientation of cargo flows towards Asia.
Current sanctions applying to the oil trade of the Islamic Republic of Iran are also influencing the tanker market and raising uncertainties. The sanctions have a direct impact on this country’s oil exports as well as on the oil trade that passes through the Strait of Hormuz. An escalation of these geopolitical tensions could lead to a shutdown of the Strait, which in turn would create oil shortages and raise oil prices to potentially extreme levels, including the range of $200-$400. Although temporary waivers have been issued for a number of countries, concerns remain with respect to the likely severe impact of the sanctions, including those enacted by the European Union. These latter sanctions prohibit insurers in Europe – marine insurers are to a large extent based in Europe and the United States – from issuing or maintaining insurance to tankers involved in servicing the oil trade of the Islamic Republic of Iran. Pressure is particularly high for some key crude importers, which could be forced to provide sovereign guarantees to tankers.
In a separate development, tanker trade has also been affected by rising operating costs resulting from the higher oil and bunker fuel prices that prevailed in 2011. Tanker operators had to reduce speed to optimize fuel consumption and also absorb excess tonnage capacity. Slow steaming has been implemented in the tanker trade, with most voyages taking place at an average of 13 knots (compared to 14 knots), and at 10-11 knots when sailing in ballast.
Refinery Developments, Shipments of Petroleum Products and Gas
In 2011, global refinery throughputs increased marginally by 0.5 per cent and averaged 75.7 million bpd. The drop in the OECD output was offset by increased production in developing countries, including India, China and those of Latin America. For the fifth time in six years, growth in throughput was out paced by growth in the global refining capacities, which expanded by 1.5 per cent in 2011. The largest capacity growth continues to take place in the Asia Pacific region and in Western Asia.
Refiners in Europe are confronted with a number of difficulties. These include a falling demand in Europe and the United States (the largest market for European gasoline), the shutdown of seven refineries, the need to seek alternative markets in Africa and Western Asia for European gasoline, and a supply and demand mismatch with refineries in Europe being geared towards gasoline production and global demand supporting diesel. The closing of refineries in Europe, however, could mean greater European imports of oil products in the future.
In 2011, world shipments of petroleum products and gas, including LNG and liquefied petroleum gas (LPG) increased by 5.1 per cent, taking the total to 1 .03 billion tons. The growth rate reflects the booming LNG trade. If gas trade were to be excluded, and using estimates for LNG and LPG trade published by Clarkson Research Services (Shipping Review & Outlook, spring 2012), the growth rate would moderate and amount to 3.3 per cent. In 2011, the United States became a net exporter of refined petroleum products for the first time on record.
Natural Gas Supply and Demand
Natural gas is the third largest source of energy consumed globally, after oil and coal. North America continues to account for the largest share of world gas consumption, although the largest growth rate was recorded in the Asian market.
In 2011, natural gas consumption increased by 2.2 per cent, with consumption in North America expanding by 3.2 per cent due to low gas prices. Elsewhere the largest growth was recorded in China, Qatar, Saudi Arabia and Japan. The combined effect of a weak economic situation, relatively high gas prices, warmer weather conditions and an incremental shift towards greater use of renewable power generation has led gas consumption in the European Union to drop by 10 per cent.
In 2011, global natural gas production grew by 3.1 per cent, with production in the United States growing by 7.7 per cent and this country ranking as the largest world producer. The United States has been gradually reducing its dependency on foreign energy supplies, in part through increased exploitation of its shale gas. Output of natural gas grew rapidly in Qatar, the Russian Federation and Turkmenistan, which helped to offset the lost output from Libya and the United Kingdom. Production in the European Union also declined as demand in the region weakened and gas fields matured or were under maintenance.
Liquefied Natural Gas Shipments
In 2011, global natural gas trade increased by 4 per cent, with 32 per cent of this trade being carried as LNG on board gas carriers and the remaining share being carried via pipelines. Shipments of LNG grew by 10.3 per cent in 2011, taking the total volume to 330 .8 billion cubic meters. Growth was fuelled by increasing exports from Qatar and increasing imports into the United Kingdom (35.3 per cent), Japan (12.6 per cent) and the Republic of Korea (11 per cent). Asia accounted for 62.7 per cent of global LNG imports, with Japan remaining the world largest importer, followed by the Republic of Korea.
Over the past few years LNG has been one of the fastest-growing cargoes owing to the increasing interest in LNG as a greener alternative to other fossil fuels. Interest in LNG heightened in 2011 as the fallout from the disaster in Japan highlighted the risk of a great reliance on nuclear power over the long term. New and expanding LNG-receiving terminals (for example, in the United Kingdom, the United States, China, the United Arab Emirates, Chile, and Thailand) are being set up, and a total of five new liquefaction projects started operations between 2010 and 2011, including those in Qatar, Peru and Norway. Overall, the outlook for LNG is positive and is supported by growing demand from Asia, including a projected growth in demand from traditionally large LNG exporters such as Indonesia and Malaysia.
One study (Brown H (2012). Norway and Russia to ride fourth wave of LNG exports. Lloyd’s List. 22 March) projects that by 2030 Norway and the Russian Federation will be driving global exports of LNG and that these two countries will lead the fourth wave of LNG exports. The first wave is taking place at the present time and is led by Qatar, the second wave is projected to occur in 2014 with Australia and the Asia Pacific region being major players, and the third wave is expected to occur around 2020 and be driven by West Africa.
Coal Production, Consumption and Shipments
With a share of 30.3 per cent of global energy consumption, coal is the second most important primary energy source and is used mainly in power generation. Global coal consumption grew by 5.4 per cent in 2011, with consumption outside the OECD countries, led by China (9.7 per cent), rising by 8.4 per cent. Despite growth in Europe, overall consumption in the OECD countries declined by 1.1 per cent due to falling demand in the United States and Japan.
Coal production grew by 6.1 per cent in 2011, with most of the growth occurring in developing countries and with China accounting for over two thirds of this expansion. Since China has emerged as a net importer of coal, coal prices have been rising, as have new investments in exporting countries, including Australia, Indonesia, the Russian Federation, Mongolia and more recently Mozambique, which has been attracting investors, especially from Brazil and India. The year 2011 saw the first coal shipment from Mozambique.
In 2011, the volume of coal shipments (thermal and coking) totaled 944 million tons, up by 5.1 per cent compared with 2010. In 2011, coking coal shipments declined by 5.5 per cent, reflecting developments on the demand side as well as supply side constraints resulting from tighter market conditions caused by output cuts from Australia. The floods in Australia interrupted coal mine operations, which reduced supply and raised coal prices. This in turn depressed demand, especially from China, where domestic supplies provide a better alternative to less competitive coal imports.
Growth in overall coal shipments held strong due to an increase of 8.7 per cent in thermal coal trade. Growing energy requirements in emerging developing countries in Asia, a stronger demand for steam coal in Europe, for a short while, high oil prices and the aftermath of the nuclear accident in Japan have all contributed to boost demand for thermal coal.
In 2011, Indonesia remained the leading exporter of thermal coal with a share of 44.9 per cent, followed by Australia (20.4 per cent). Strong demand in China and India as well as in Europe has boosted thermal coal imports. Import levels in Japan and the United States dropped due, in part, to the aftermath of the March 2011 disaster in Japan, stringent environmental regulation and comparatively low gas prices in the United States.
One study projects that Australia will overtake Indonesia as the biggest exporter of coal by 2016. Australia is investing in the establishment of new mines and expanding existing ones. According to the Australian Bureau of Agricultural and Resource Economics and Sciences, by October 2011 there were 20 committed coal-mining projects in the country and 76 proposals. Meanwhile, some observers are noting that the growing power generation needs in Indonesia may constrain the country’s exports starting in 2014. This would likely provide an opportunity for other suppliers, including those situated in locations distant from China, to step in and meet the growing demand. Potential new players that may develop a bigger role include the United States, the Russian Federation, South Africa and Mongolia. Main world coal importers and exporters are featured in the table below.
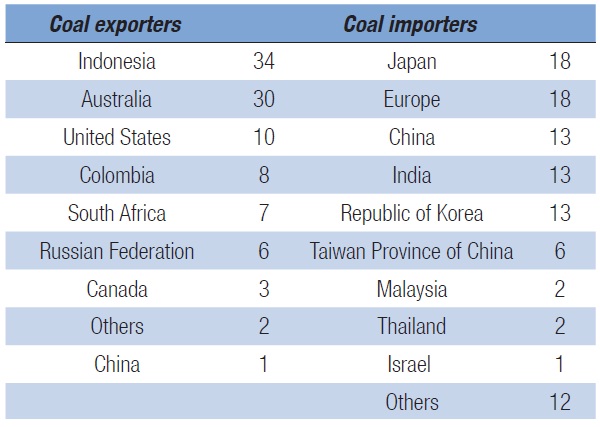
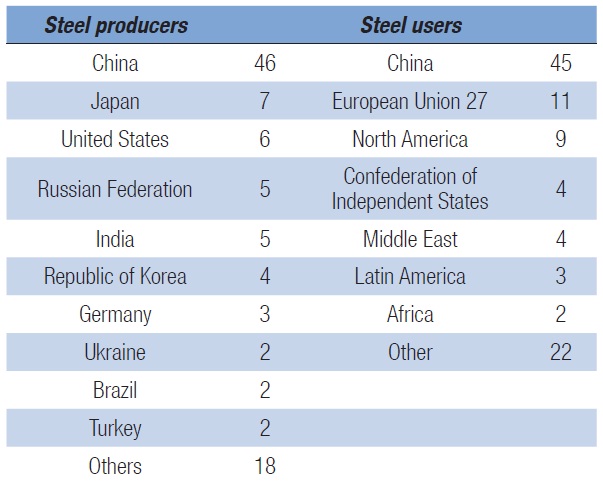
Source: UNCTAD secretariat on the basis of data from the World Steel Association (2012), Clarkson Research Services, published in the June 2012 issue of Dry bulk Trade Outlook, and the World Grain Council, 2012.
The outlook for coal trade remains promising, as developing nations continue to require more coal to meet their energy needs. It remains subject, however, to developments in coal production and consumption patterns in China, as the scale of the country’s large domestic supply means that any small shift could turn the country into a net exporter again. Additionally, the country’s Five-Year Plan for the period 2011 to 2015, which aims to reduce the energy and carbon intensity of the economy, is likely to impact on coal trade.
Iron Ore and Steel Production and Consumption
In 2011, iron ore trade expanded by 6 per cent, taking the total volume past 1 billion tons. This growth remains highly concentrated with China being the main driver.
Major iron ore exporters in 2011 were Australia, Brazil, India, South Africa and Canada (see table below). With a joint market share of 73 per cent, Australia and Brazil increased their export volumes by 8.9 per cent and 6.4 per cent, respectively. Except for India, where iron ore exports were constrained by the introduction of mining and export bans, as well as higher export duties, all other exporters have recorded positive export growth.
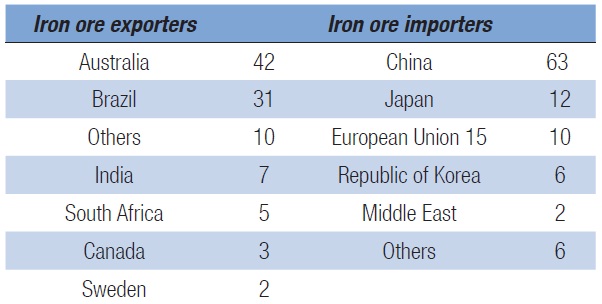
Source: UNCTAD secretariat on the basis of data from the World Steel Association (2012), Clarkson Research Services, published in the June 2012 issue of Dry bulk Trade Outlook, and the World Grain Council, 2012.
Reflecting their weaker economic stance, European countries reduced their iron ore imports by 3.7 per cent, while Asian developing countries recorded an increase of 2 per cent. Although positive, this rate is dwarfed by the 32 per cent recorded in 2010. Import demand in China increased by a strong 10 per cent, anchoring the country’s dominance in this particular trade. Most other Asian countries increased their imports, but Japan and Indonesia recorded a decline of 4.4 per cent and 21.7 per cent, respectively.
In 2011, concerns were raised regarding new port restrictions introduced by Chinese authorities. These would restrict access to the purpose-built very large ore carriers (VLOCs) of 400,000 dwt, owned or ordered by Vale to service booming iron ore demand from China. For Brazil, in particular, the strategic importance of its bilateral trade with China cannot be overemphasized. Brazilian exports to China increased by 46.1 per cent in 2011 to reach $44.3 billion, up from $30.8 billion in 2010, while exports from China to Brazil grew by 34.6 per cent to $32.8 billion. Iron ore accounts for 40 per cent of Brazilian exports to China, soybeans for 27 per cent, crude oil for 10.5 per cent, pig iron for 4 per cent and sugar for 2.7 per cent. Brazil and China are increasingly investing in port infrastructure projects to address any potential bottlenecks that may hinder this trade.
Although it remains subject to developments in the wider economy and the steel-making sector, and more importantly, to the effect of new macroeconomic policies being instigated by China, the outlook for iron trade remains positive, with shipments projected by Clarkson Research Services to grow by 6 per cent in 2012.
Grain Shipments
Total grain production in the crop year 2010/2011 fell by 2.6 per cent to 1.75 billion tons, while production in the crop year 2011/2012 increased by 5.1 per cent, taking the total to 1.84 billion tons. World grain consumption increased by 1 per cent in 2010/2011 to reach 1.79 billion tons and further increased in 2011/2012 by 2.8 per cent, taking the total to 1 .84 billion tons.
World wheat consumption is expected to increase from 657 million tons in 2010/2011 to 688 million tons in 2011/12, up by 4.7 per cent. Food use accounts for over two thirds of the total growth. However, with maize supplies being more limited and prices being higher, lower-grade wheat becomes a good alternative for use as feed stock. Industrial use remains small but
is expected to grow as demand for wheat-based ethanol increases.
World grain shipments totalled 347 million tons in the full year 2011, up by 1.5 per cent over 2010. Wheat and coarse grain accounted for 73.8 per cent of the total grain shipments. For the crop year 2011/12, volumes of wheat exports increased by 15.6 per cent due to a strong demand, especially from developing economies, and improved harvests. These factors eased wheat prices. Wheat export increases were recorded in Argentina (50 per cent), Australia (24.9 per cent) and Canada {10.4 per cent}. Exports by majors such as the United States and the European Union dropped by 21.9 per cent and 29.1 per cent, respectively, due in particular to better priced grain from other regions, including from the Black Sea. Meanwhile, shipments of coarse grains increased by 5.8 per cent, with large increases recorded in Australia (51.1 per cent) and Argentina (9.7 per cent).
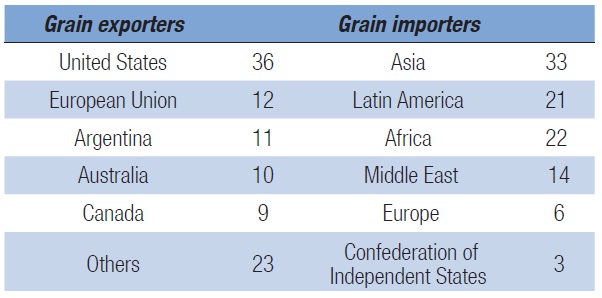
Source: UNCTAD secretariat on the basis of data from the World Steel Association (2012), Clarkson Research Services, published in the June 2012 issue of Dry bulk Trade Outlook, and the World Grain Council, 2012.
Bauxite/Alumlna and Phosphate Rock
Bauxite ore is mined and then transferred to a refinery for the processing and extraction of alumina. The world’s largest bauxite deposits are located in Guinea, Australia, Brazil and Jamaica. In 2011, world production of alumina increased by 8 per cent over 2010, Growth resulted mainly from the increased production of bauxite (6 per cent) from expanded, new and reopened mines in Brazil, China, Guinea, India, Jamaica, Suriname and the Bolivarian Republic of Venezuela. Bauxite production in Australia declined slightly because of the flooding that forced production cuts at some mines. World trade in bauxite/alumina increased by a strong 17.2 per cent, totaling 109 million tons in 2011.
World phosphate rock production capacity is projected to increase by nearly 20 per cent between 2011 and 2015, with most of the increases occurring in Africa, in particular Morocco. Other new mines are planned in Australia, Brazil, Namibia, and Saudi Arabia. World consumption of phosphate rock for fertilizers is projected to grow at a rate of 2.5 per cent per year during the next 5 years, with the largest increases being in Asia and South America. Phosphate rock volumes increased by 8.7 per cent, down from 15 per cent recorded in 2010. Total volumes reached 25 million tons, reflecting in part the continued improved economic situation in the first half of the year. With no substitute s for phosphorus in agriculture, increased demand for grain and improved production levels have also contributed to the continued growth. Growing demand for fertilizers and increased production by new or expanding plants in producing countries are expected to sustain growth in phosphate rock trade.
Dry Cargo – Minor Bulks
In line with developments in the world economy and the deceleration of growth since the third quarter of 2011, growth in minor bulks trade decelerated to 6.1 per cent. Global volumes reached 1.2 billion tons, a level surpassing the pre-crisis peak of 1.1 billion tons achieved in 2007. Exports of metals and minerals recorded the second fastest growth (7.4 per cent) after agri-bulks (8,6 per cent), while manufactures expanded by 5.6 per cent and fertilizers (excluding phosphate rock) grew by 4.3 per cent. The only contraction recorded was in sugar volumes, which fell by 7.4 per cent, following a growth of 11.9 per cent in 2010. Looking to the future, trade in minor bulks is projected to expand further in 2012, albeit at a slower rate, reflecting in part the weakening in the world economy and the slowdown in steel production activity, an important source of demand for a number of minor bulks.
Containerized Cargo
Accounting for about 62 per cent of the remaining 2.2 billion tons of dry cargoes, world container trade, expressed in 20-foot equivalent units (TEUs), grew by 7.1 per cent in 2011, down from 12.8 per cent in 2010. According to Clarkson Research Services, total container trade volumes amounted to 151 million TEUs in 2011, equivalent to about 1.4 billion tons. These headline figures conceal some differences at regional and route levels that have Significantly impacted the container trade market during the year.
Global growth in 2011 was limited by the slowdown recorded on the main-lane East-West trade. As shown on the table below, trade on the trans-Pacific route declined by 0.5 per cent while volumes on the Asia-Europe and trans-Atlantic routes expanded by 6.3 per cent and 5.7 per cent, respectively.
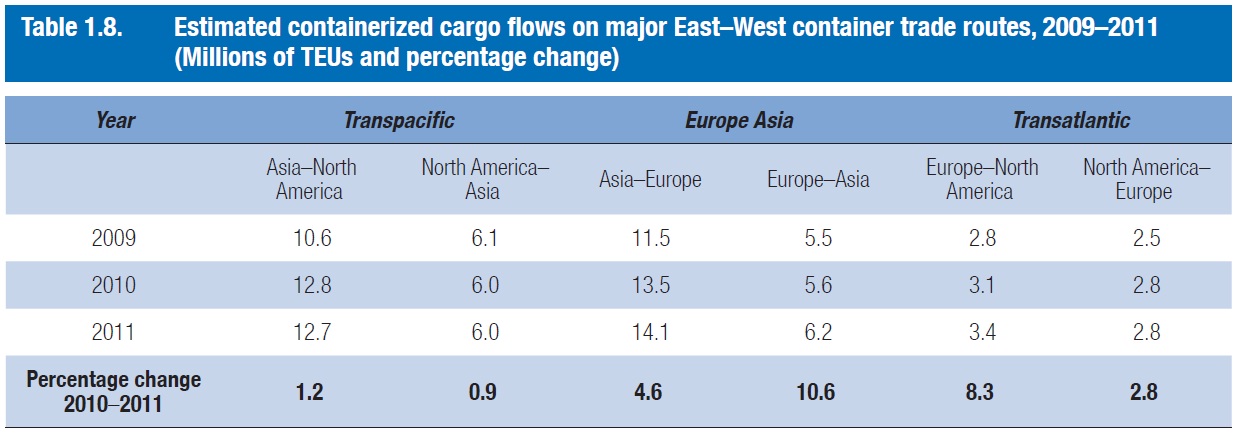
Source: UNCTAD based on Container Trade Statistics, March 2012; Containerisation International, 1 September 2012; and the Global Insight Database as published in Bulletin FAL, issue number 288, number 8/2010 (International maritime transport in Latin America and the Caribbean in 2009 and projections for 2010), ECLAC.
Growth was mainly generated by increased demand for imports in developing regions, with container trade volumes expanding strongly on the non-main-lane East-West, North-South and intra regional lanes. Non-main-lane East-West trade grew by 8.9 per cent, while North-South and intra regional trades expanded by 8.9 per cent and 9.2 per cent respectively. According to data from Clarkson Research Services, in 2011, the three main-lane trades totaled 47.3 million TEUs, while the non-main lane trades reached 103,3 million TEUs. One current opinion maintains that greater containerization could help generate additional cargo for container shipping. It is argued that unconventional commodities can be carried increasingly in containers.
These include, for example, larger volumes of scrap steel and recycled paper from North America and Europe to Asia, and general cargo and bulk commodities that can be transported in smaller batches and containerized (for example, segments of food commodities and raw materials). Other commodities include more refrigerated cargo, chemicals and even Handysize loads of bulk commodities, such as iron ore, which is reported to have already been shipped in small parcels from Africa to China. For these ideas to materialize, however, prevailing price and cost barriers need to be removed and cost-effectiveness and vessel specifications need to be assessed.
The policy of China to move up the value chain in global manufacturing is causing manufacturing operations of low-value goods to relocate to other lower-cost production sites such as in Viet Nam, Bangladesh and Indonesia.54 Chinese manufacturers have been moving up to the value chain as exports in power equipment, auto parts and electronics are growing faster than average. Research from the Boston Consulting Group argues that with rapidly rising labour costs in China, manufacturing business could shift operations from China back to the United States.56 Another research by Cost and Capital Partners suggests that relocation is taking place towards Mexico rather than the United States in view of Mexico’s cost competitiveness and more reliable supply chains.57 This is further illustrated by recent data from Piers indicating that exports from China to the United States have been growing at a much slower rate (2 per cent for the 12 month period up to January 2012) than exports from Mexico to the United States (68 per cent over the same period). Overall, both the cost and the transit time of shipping are viewed as key considerations for moving from China to Mexico.
Import demand from China could also have a deep impact on future container trade patterns. Supported by the policy within China of promoting greater consumer spending, some re-balancing of container trade flows is emerging, breaking away from past trends as container ships are increasingly sailing full to China. The shift not only reflects the robust Chinese demand for raw materials and commodities, including metals, waste paper and plastics, but also its growing demand for higher-value goods. These include items such as machine tools and instruments, hi-tech products, luxury goods and cars.
In a separate development and against a background of increasing costs and lower earnings, container shipping witnessed a structural change in 2011 with the emergence of alliances and oligo-polistic competition. At the same time, decisions to maintain exemptions of liner shipping from the application of competition laws have been made by a number of administrations during the year. In February 2012, a study for the United States Federal Maritime Commission (FMC) did not confirm the merit of repealing the exemption, while in Singapore, the block exemption from competition rules for liner shipping agreements was extended until 2016. Japan also decided to maintain its antitrust immunity system till at least 2015, while an agreement by the Asia-Pacific Economic Cooperation (APEC) forum was adopted in 2011 setting up guidelines on maritime competition rules for consortia. In Europe, however, where such exemptions were repealed in 2008, compliance with the competition law continues to be enforced by the European Commission, which in March 2012 fined 14 international logistics companies, including UPS and Kuehne and Nagel, €169 million for operating four price-fixing cartels.
Finally, another important concern for the container industry was dealt with in 2011 as the call by the shipping and port industries for mandatory controls on the weighing of freight containers received full attention at the International Maritime Organization (IMO). An amendment to the International Convention for Safety of Life at Sea (SOLAS) to create a new legal obligation requiring containers’ actual weight to be verified prior to loading aboard a ship is now being considered by IMO. The need for this requirement became more evident after the accident of the container ship MOL Comfort.
Source: UNCTAD The Review of Maritime Transport for 2012


Leave a Comment