The information contained in this post are extracts from The ATSB “Australian Shipping Occurrences Statistics 2005 to 2012” which provides information on what accidents and incidents have happened during the analysis period, how often they have happened, and what can be learnt from them. Incidents, and injuries happen more often than is widely believed. Some of the most frequent accident types are preventable, particularly fatalities to crew and shipboard workers. Lessons learned from the experiences of others in the industry can help identify the safety risks in their operation that could lead to a similar accident or serious incident. Analysis of reported occurrences helps to understand why accidents and incidents happen, and where the major safety risks are.
The information below is based on safety occurrences involving Australian registered trading vessels (cargo and/or passengers) around the world and trading vessels flying foreign flags within Australia’s maritime jurisdictions.
Occurrence Categories
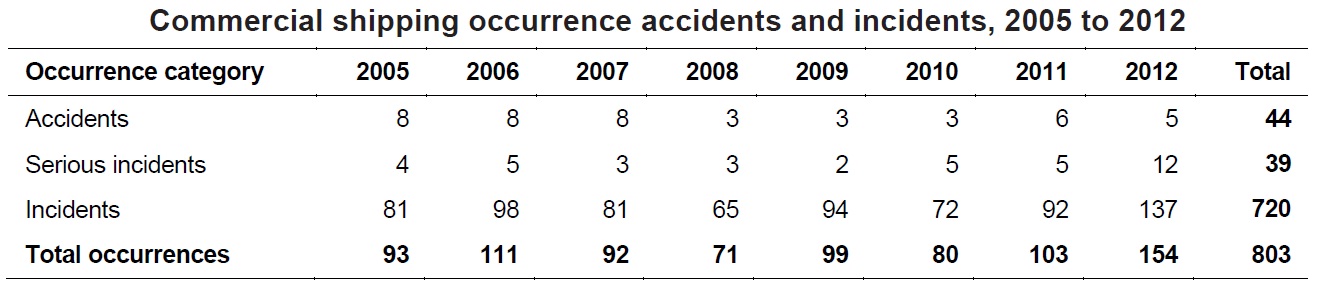
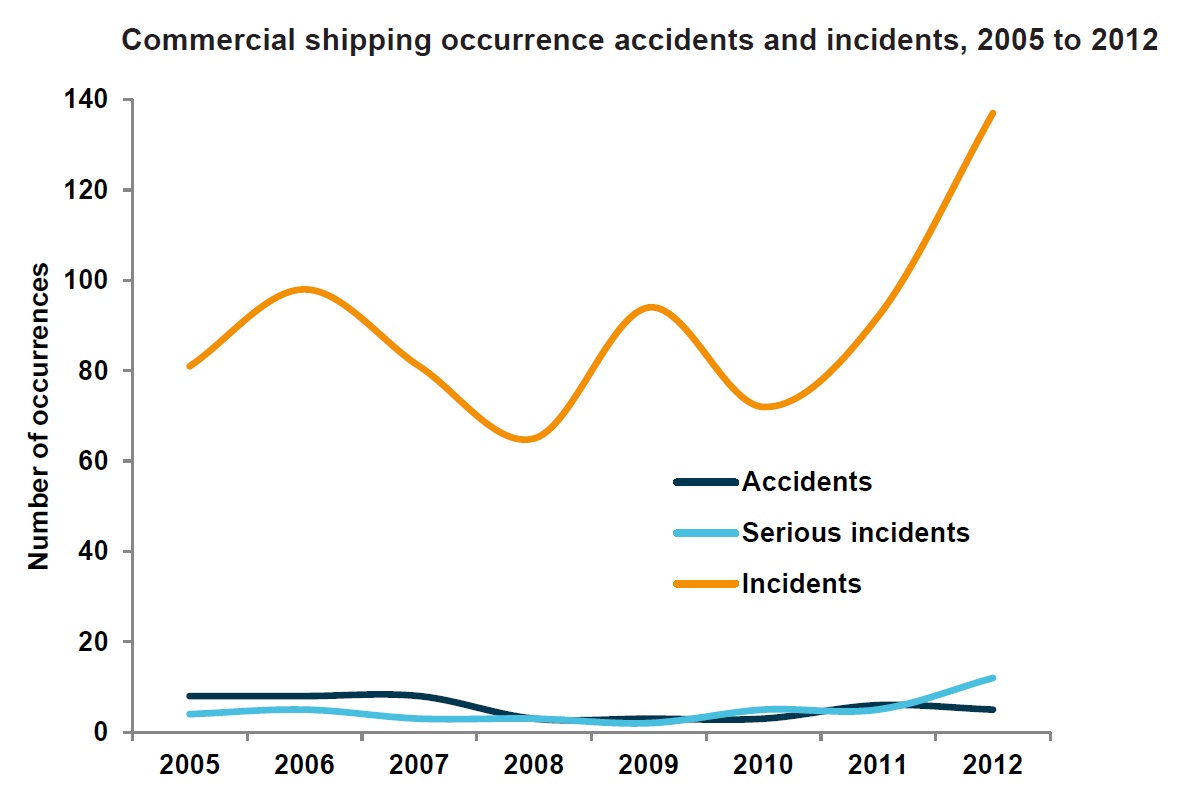
The figures below shows the number of shipping occurrences from 2005 to 2012 related to Australian vessels or vessels within Australian marine jurisdictions. There was an average of 100 occurrences each year across the period, which consisted (on average) of 90 incidents, 5 accidents and 5 serious incidents.
In 2011, there were six accidents which involved:
- The death of the boatswain (bosun) on board the bulk carrier Hanjin Sydney as a result of injuries received after falling about 25m from the hatch coaming of the ship’s number eight cargo hold to the tank top below.
- The death of an advisor on the tug Adonis who was trapped in the wheelhouse when the tug capsized in the port of Gladstone.
- A crew member of the bulk carrier CSL Thevenard sustaining a serious injury when his finger was crushed by a roller whilst closing a cargo hatch lid.
- The death of an oiler from the car carrier Pegasus Ace who was lost overboard.
- The death of the master of the bulk carrier Ocean Caesar who was lost overboard.
- The death of a seaman from the container ship MSC Siena’s who was knocked off the accommodation ladder by a wave and was lost overboard near Rottnest Island off the port of Fremantle.
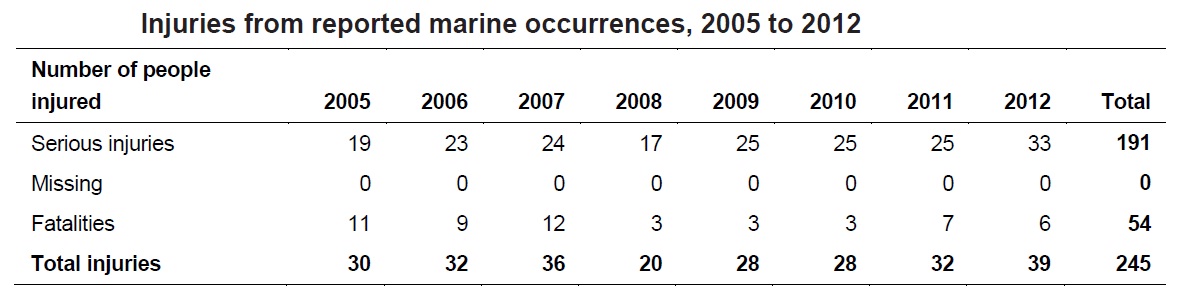
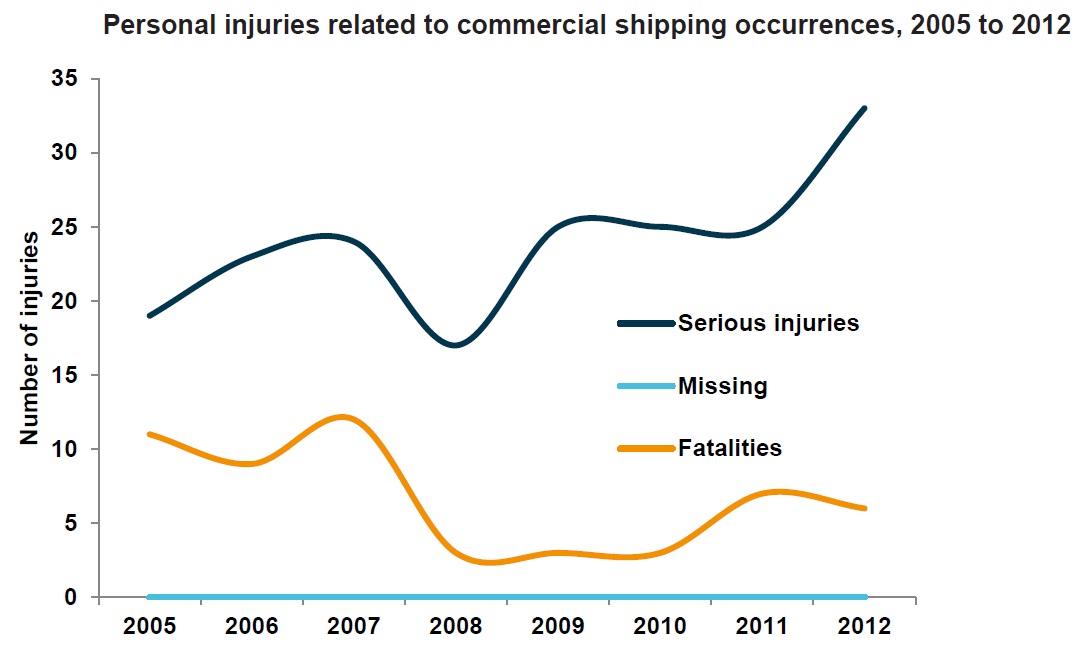
Injuries
Between 2005 and 2012, there were 213 occurrences involving fatalities, serious injuries or people missing overboard. Some occurrences involved multiple injuries with a total of 245 people killed, missing or seriously injured.
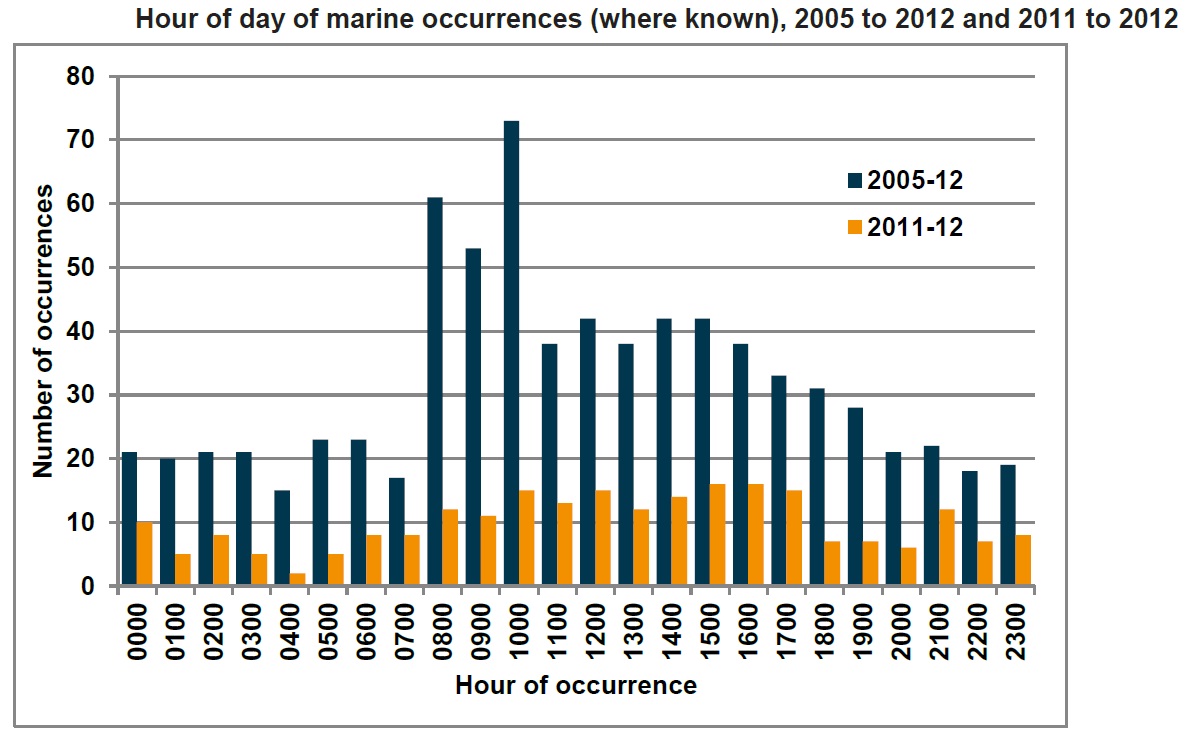
Time of Marine Occurrences
The figure below shows the approximate time of day of marine occurrences (where known) for the periods 2005-12 and 2011-12. For 2005-12, there was a peak in occurrences between 0800 and 1100. The number of occurrences is fairly constant through the late morning and afternoon and then gradually decreased to 2000. Between 2000 and 0800, the number of occurrences each hour remained consistently low.
For 2011-12, occurrences increased from a low at 0400-0500 to an afternoon peak between 1500 and 1700. The morning peak of 2005-12 is not evident, with occurrences more evenly spread throughout the late morning and afternoon. The number of occurrences each hour is lower through the evening and early morning with spikes at 21:00-22:00 and midnight-01:00.
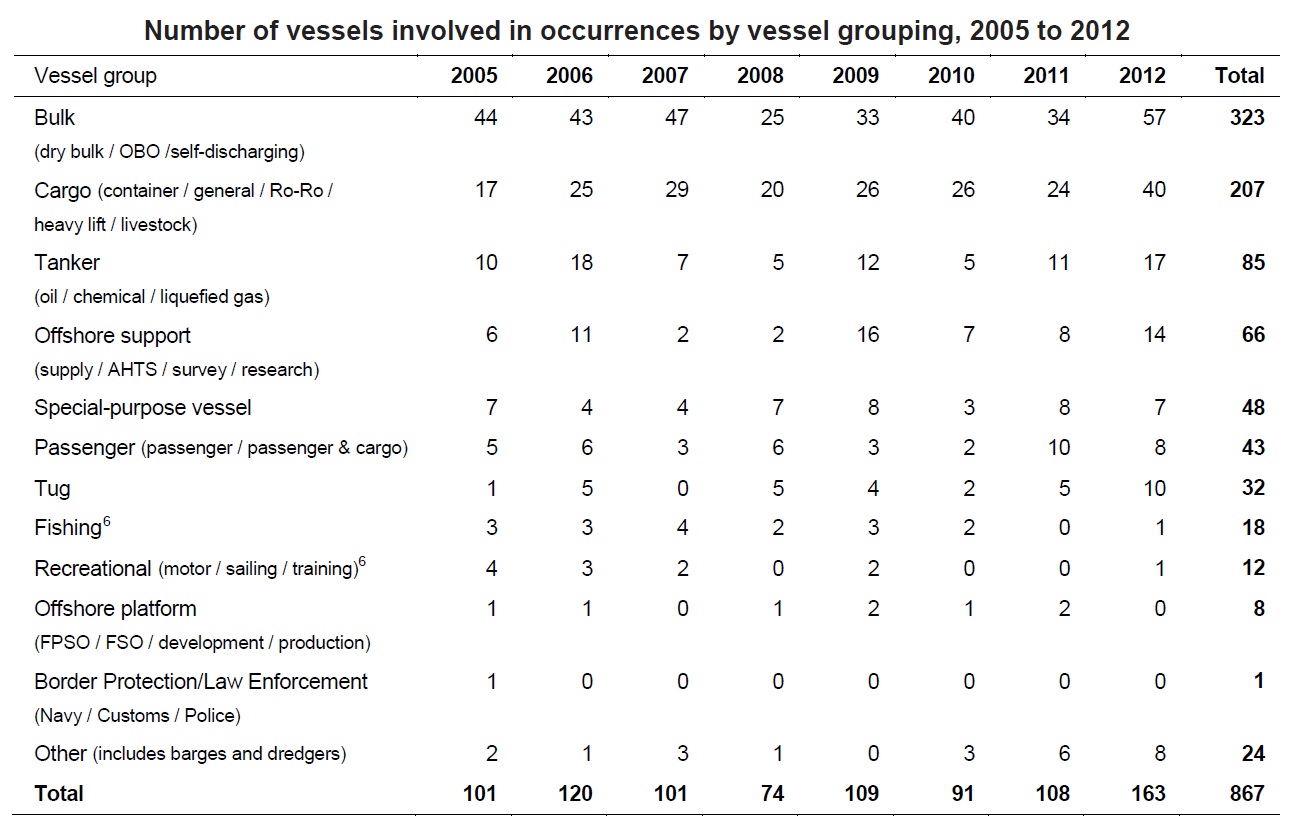
Types of Vessels in Marine Occurrences
The table below shows all vessels involved in commercial shipping occurrences by vessel group. The brackets describe the different types of vessels that are grouped into these categories. The ‘other’ category includes vessels such as barges and dredgers, which had low numbers of occurrences, or where the vessel was unknown.
Due to the nature of mandatory reportable incidents under Australian legislation, mainly large commercial vessels are involved in occurrences reportable to the ATSB. Some smaller vessels, such as fishing and recreational vessels only appear in the ATSB database due to their interactions with larger vessels. Therefore, data for these vessel groups shown in the table below are not indicative of the total number and type of incidents and accidents involving these types of smaller vessels.
Bulk carriers and cargo vessels made up the vast majority of marine occurrences and fluctuations in the number of occurrences within these vessel groups has a large effect on the total number of marine occurrences. The substantial increase in the total number of vessels involved in occurrences in 2012 largely reflects the involvement of bulk and cargo vessels but there were also increases in the involvement of tankers, offshore support vessels and tugs.
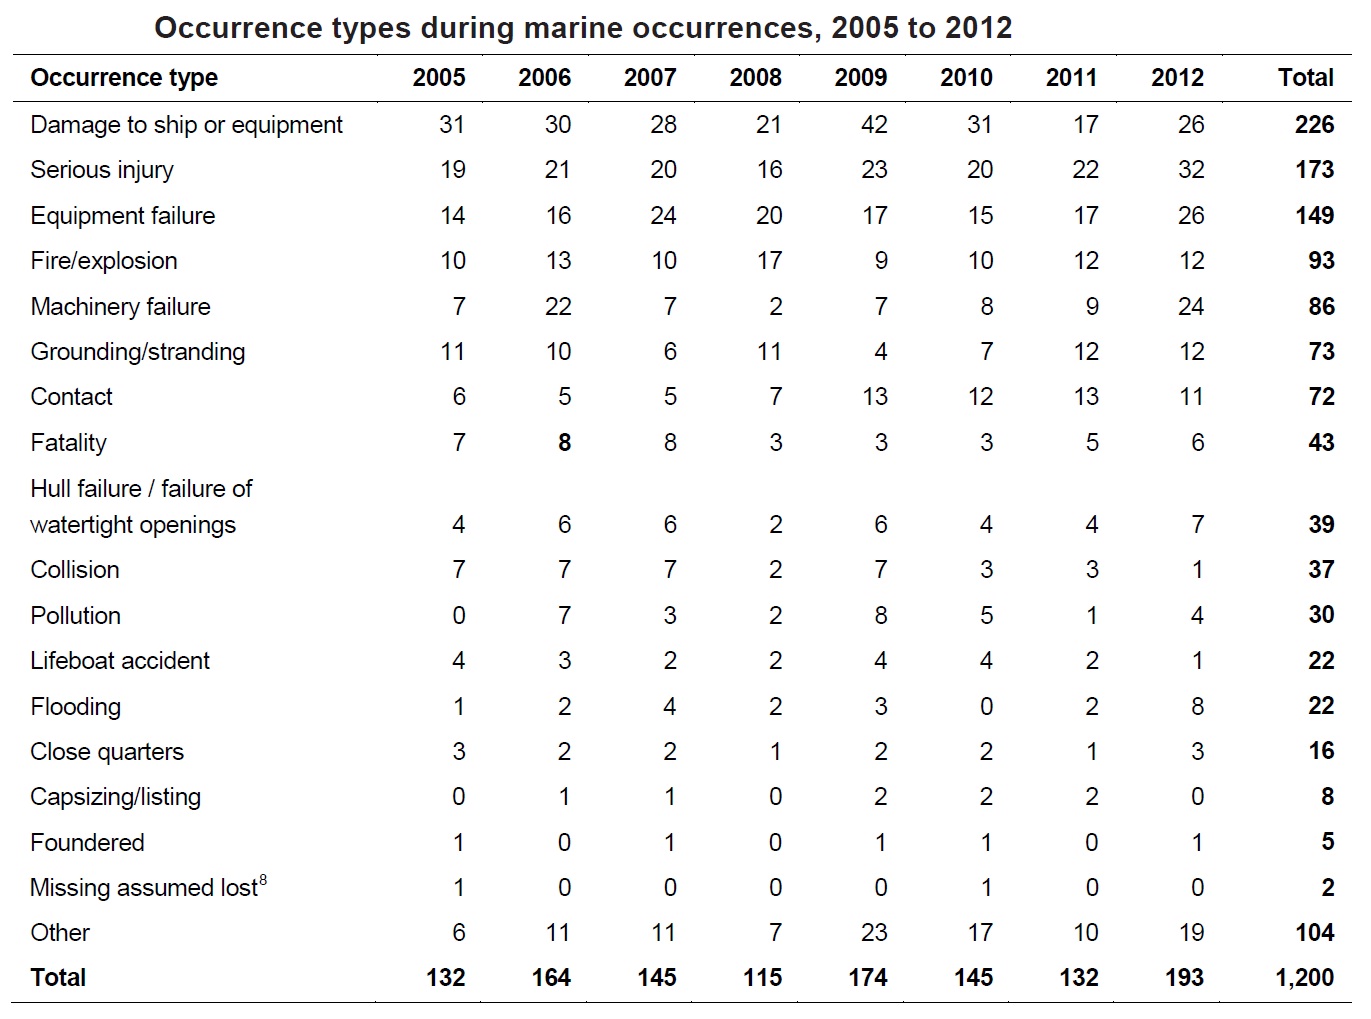
Occurrence Types
There were 1,200 unique occurrence types associated with Australian marine occurrences between 2005 and 2012. The table below shows that the top three occurrence types were damage to the ship or equipment (present in 226 occurrences), serious injury (173 occurrences) and equipment failure (149 occurrences). In 2012, there was a 46 per cent increase in the number of occurrence types identified compared with 2011. There were increases in five of the six most common occurrence types, with serious injury, equipment failure and machinery failure reaching their highest levels for any year of the 2005-2012 period.
Between 2005 and 2012, the number of occurrences involving pollution each year has fluctuated between zero and eight. Of the 30 pollution occurrences across the whole period, 10 involved gas and 10 involved fuel or oil leaks. In 2011-12, four of the five pollution-related occurrences involved fuel or oil leaks. The pollution-related occurrences in 2011-12 involved the following:
- An estimated 5 tonnes of fuel oil were spilled during bunkering operations between the bunker vessel Valiant III and the livestock carrier GL Lan Xiu at Hamilton Wharf, Brisbane.
- Approximately 2,150 litres of marine gas oil were spilled into Mackay Harbour during fuel transfer operations on board the tug Terlak when a tank high level alarm failed to operate and fuel overflowed out of the breather pipe.
- About 25 to 50 litres of oil were spilled off Barrow Island, WA, when the tug BKM 102 collided with Taurus II whilst manoeuvring alongside. The tug’s hull was punctured resulting in water ingress and an oil spill.
- About 50 litres of marine gas oil were spilled into the harbour and 100 litres onto the deck of the fishery patrol vessel Steve Irwin when a fuel line was blown through and fuel sprayed from the fuel tank vent following the transfer of bunkers from the tanker Zemira at Williamstown, Melbourne.
- Less than 5 litres of linear alkyl benzene were spilled into Botany Bay in Sydney from a defective manifold pressure valve during the discharge of cargo from the tanker Golden Wave.
Source: Australian Transport Safety Bureau


Leave a Comment