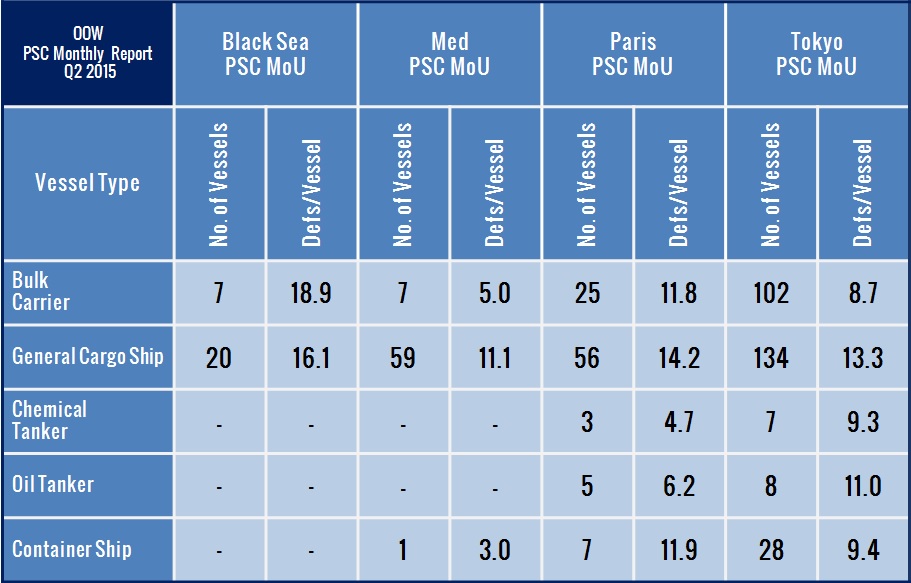
The second quarter of 2015 PSC inspections in Black Sea and Mediterranean PSC MoU were slightly decreased compared to the numbers of the first quarter. The same occurred for Paris PSC MoU, whereas for Tokyo PSC MoU the total number of PSC inspections was increased. The PSC inspections that resulted in identifying deficiencies onboard vessels was decreased for the Black Sea, Mediterranean and Paris PSC MoU but was increased for the Tokyo PSC MoU.

What is worth noting is that for Black Sea the number of detained vessels was decreased considerably, from 62 detentions in Q1 to 34 detentions for Q2. The same trend appeared also for the number of detained vessels in the Paris PSC MoU where during Q2 2015 only 118 vessels were detained compared to the 164 detained vessels of Q1 2015. For the Mediterranean PSC MoU the figure was raised from 51 to 72. A small increased in the number of detained vessels was also observed for Tokyo PSC MoU, from 308 detained vessels on Q1 2015 to 316 for Q2 2015.

For Q2 2015 in the Black Sea PSC MoU area the number of Bulk Carriers was decreased considerably although the average number of deficiencies was increased. The number of the detained General Cargo Ships also decreased along with the respective average number of deficiencies raised during the PSC inspection.It is worth noting that in the Black Sea PSC MoU area no deficiencies were noted for Chemical Tankers, Oil Tankers and Containerships. For the Mediterranean PSC MoU, in overall, the number of the detained Bulk Carriers, General Cargo Ships and Containerships was increased, especially for General Cargo Ship were it was raised from 36 vessels in Q1 2015 to 59 vessels for Q2 2015. For the Paris PSC MoU area the number of detained vessels was decreased for all vessel types with the exception of Oil Tankers where 5 vessels got detained during Q2 2015. For the Tokyo PSC MoU area (Asia-Pacific region) for Bulk Carriers and General Cargo Ships the number of detained vessels was increased. On the contrary detentions for Chemical Tankers, Oil Tankers and Containerships were less during Q2 2015.
In the images below, the ports where most of the detentions took place per PSC MoU areas are being shown. These illustrations can help in giving an idea of the most “strict” ports and also highlight the importance of having a well prepared ship visiting these places. Of course it should be kept in mind that the numbers below are only an indication and an increased number in PSC detentions does not necessarily mean that a vessel has higher possibilities of getting detained if she calls to one of these ports. For example one port may have an increased number of merchant vessels visits thus the increased number of inspections and relevant detentions.

For the Black Sea PSC MoU the ports where more than 3 detentions were noted for Q2 2015 were Novorossiysk, Samsun and Constanta. However, it is worth noting that in Novorossiysk 10 detentions were recorded which is half from what was recorded during Q1 2015 (22 detentions). Same trend was observed also for Constanta where 3 detentions were recorded in comparison to the 8 detentions of Q1 2015.
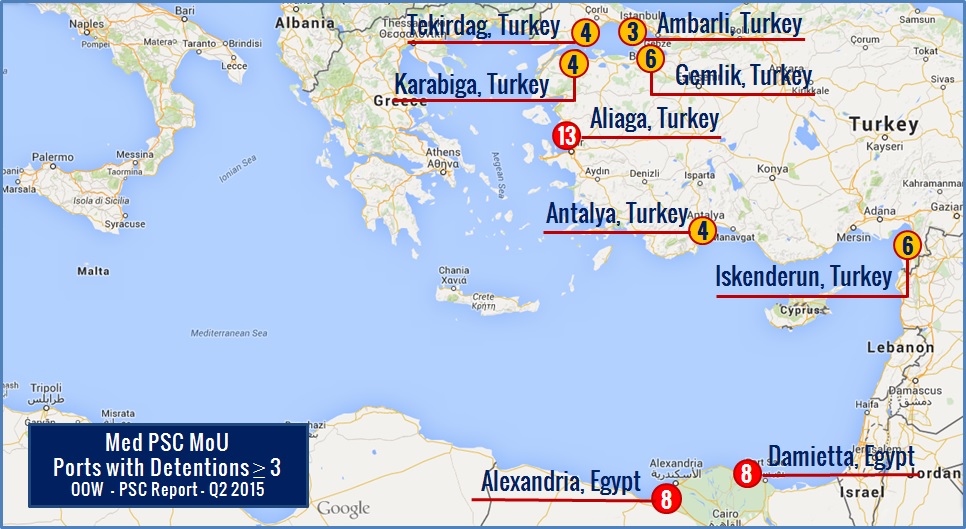
For the Mediterranean PSC MoU what is worth noting is the fact that the majority of the ports where more than 3 detentions were recorded were Turkish ports. The detained vessels in Alexandria in Egypt still remains high were 8 vessels were detained during Q2 2015. The same number of detained vessels was also observed in Damietta, Egypt.


In the Paris PSC MoU area, as already mentioned above, the overall number of detentions was decreased and this was also reflected to the fact that ports where more than 3 detentions were recorded were fewer compared to Q1 2015. It is worth noting that most of the detentions occurred in the following ports: Piraeus (7), Szczecin (7) and Antwerp (6).


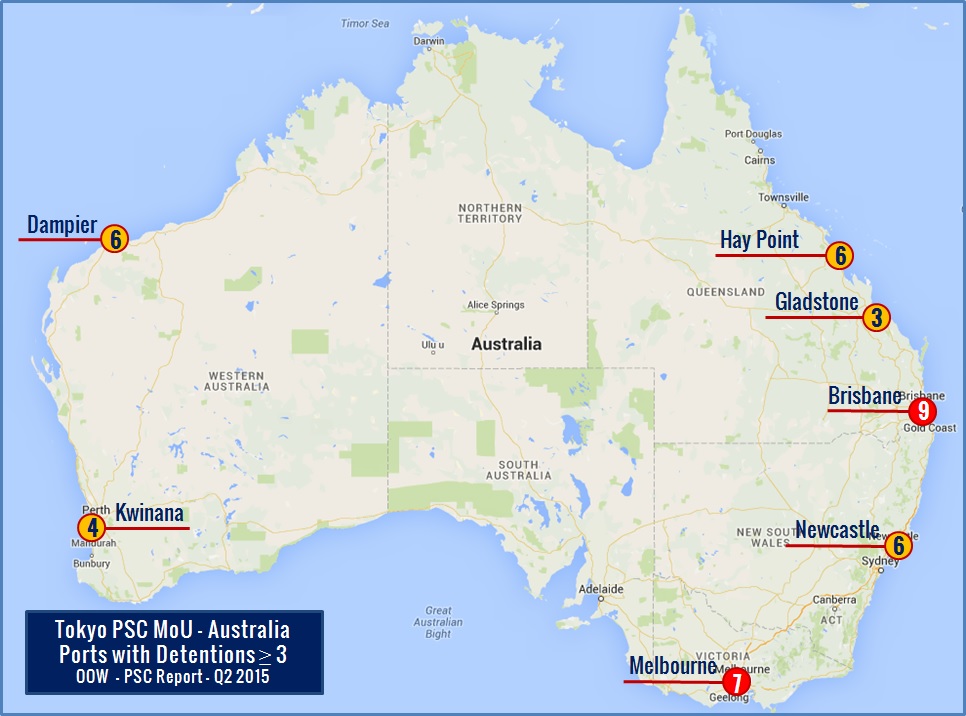
For the Tokyo PSC MoU the most notable ports where a great numbers of detentions occurred were: Nagoya in Japan, Tangshan/Tianjin/Weihai/Lianyungang/Xiamen/Shenzhen/Hong Kong in Chian, Singapore, Tanjung Priok in Indonesia and Brisbane/Melbourne in Australia.
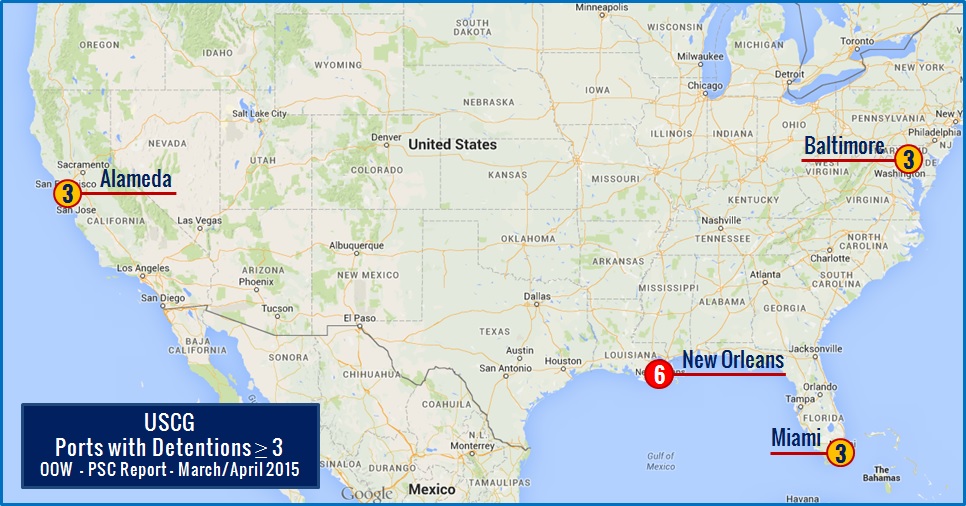
Regarding the USCG the data used are referring only to the detentions for the month of March and April 2015 since until the time this report is being released there aren’t any other data available by the USCG.
The information contained in this report have been gathered mainly from PSC MoUs websites as well as from various Coast Guard Authorities and may serve only as reference for the inspections being carried out onboard merchant vessels. The consistency of the information may differ between MoU since there are slight differences on the way each organization presents the inspection info as well as due to the fact that some countries are member in more than one PSC MoU.
Please click the following link in order to download the full report OOW PSC Quarterly Report 2015 Q2. The PDF version of this report can be also found in the OOW profile in Scribd and is also embedded down below for easy reference.
Sources used for the development of this report:
- Caribbean MoU
- Black Sea MoU
- Mediterranean MoU
- Vina del Mar
- Abuja MoU
- Indian Ocean MoU
- Paris MoU
- Tokyo MoU
- Riyadh MoU
- USCG
- AMSA
- Transport Canada


Leave a Comment