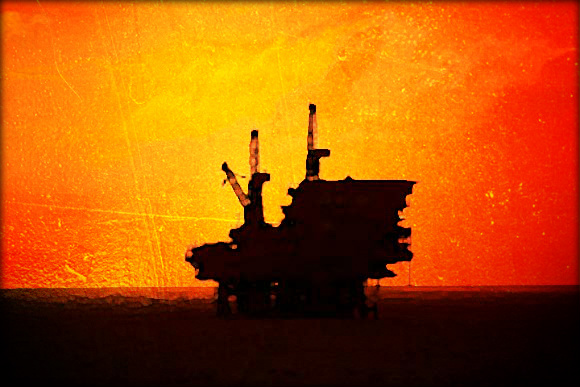
The negative impacts of an accident are hard to quantify precisely, they will of course depend on the type, the scale, the time and the location of the event. In the case of an oil spill, its duration and the type of the oil will also have a major impact. The costs of an offshore accident will include costs to the operator (damage to the installation, lost oil, containment, cleanup, litigation etc.) and third-party costs to victims, to natural resources, the government and the affected individuals/businesses (including lost income). The information presented below are an abstract from the “Safety of offshore oil & gas Impact Assessment Annex I” working paper from the European Commission, published in 2011 to accompany the proposal for a regulation of the European Parliament on safety of offshore oil and gas prospection, exploration and production activities.
The following information are addressing the property losses of ‘major accidents, resulting in at least one of the following:
- Multiple fatalities.
- total loss or severe damage to offshore units. Total loss of the unit including constructive total loss from an insurance point of view; however, the unit may be repaired and put into operation again.
- A minimum of 1000 barrels, or 136 tonnes, of oil spilt.
Non-major accidents, such as trips, slips and falls, result in less economic loss per incident, but are much more common.
Finally, the following analysis does address the costs related the loss of human life (the statistical value of a life is put at €1-2 million by the European Commission and at £1.5 million by the UK HSE). The monetization of human life can pose ethical difficulties, and loss-of-life costs are not estimated to be significant when put into the context of the very large costs this report focuses on.
The Deepwater Horizon disaster demonstrated how huge and far-reaching the consequences of a single accident can be, particularly as regards maritime and coastal pollution.
- 11 people lost their lives
- an estimated 4.9 million barrels (660,000 tonnes) of oil were spilled into the sea
- and a state-of-the-art drilling rig, valued at US$560 million, was written off as a total loss in the disaster
- the oil spill occasioned a response effort involving 48,000 people, 6,500 vessels and 125 aircraft at its peak
- total damages are estimated to reach tens of billions of dollars
In early 2011, BP estimated its costs related to the accident (including costs incurred by the end of 2010 and estimated obligations for future costs) at 40.9 billion dollars.
Even a company like BP, one of the largest multinational oil companies, has been shaken by such an accident. In two months, its shares lost more than half their value. In order to be able to pay the related costs (containment and cleanup, claims from affected businesses and individuals, potential fines/penalties etc.) the company suspended the payment of dividends and initiated a US$30 billion asset divestment program.
Whilst this accident provides one important indication of the potential costs of a similar incident in European waters, significant juridical differences between the US and EU limit the scope for direct comparison. Additionally, the cost of an oil spill depends on a number of variables other than just the simple volume of spillage, and the conditions in much of Europe are unique. For example, a spill in a closed sea with limited natural circulation of water – such as the Mediterranean, the Black or Baltic Seas – will present a different set of challenges than a spill in the Gulf of Mexico. To be more specific factors affecting the cost of oil spills other than spill volume can be summarized as follows:
- Location: The costs incurred per unit of spilled oil vary greatly depending on the spill’s location. For example, the extent to which the oil reaches the shoreline is a significant factor boosting the costs of a spill. Moreover, the temperature of the water can make a large difference to its dispersal. Finally, spills can variably reach environmentally or economically sensitive areas, fishing zones or areas with other maritime activities, enhancing the litigation and clean-up costs.
- Type of oil: Oil grades vary in terms of gravity, viscosity, volatility, toxicity and other properties, making them more or less difficult and costly to clean up.
- Season/weather: In some cases, natural forces serve to either decrease or increase the potential financial impact of an oil spillage. For example, wind speed and cloudiness can respectively affect the dispersal and evaporation of oil spills on the water’s surface. Weather conditions can obviously influence the response efforts as well.
- Clean up response/method: In addition to the above variables, the chosen mode of response depends on the legal and regulatory regime governing pollution of the environment. When clean-up methods are required (i.e. when natural clean-up is deemed deficient), the cost of dispersants, in-situ burning and the use of tools such as booms, as well as total labour costs need to be taken into account.
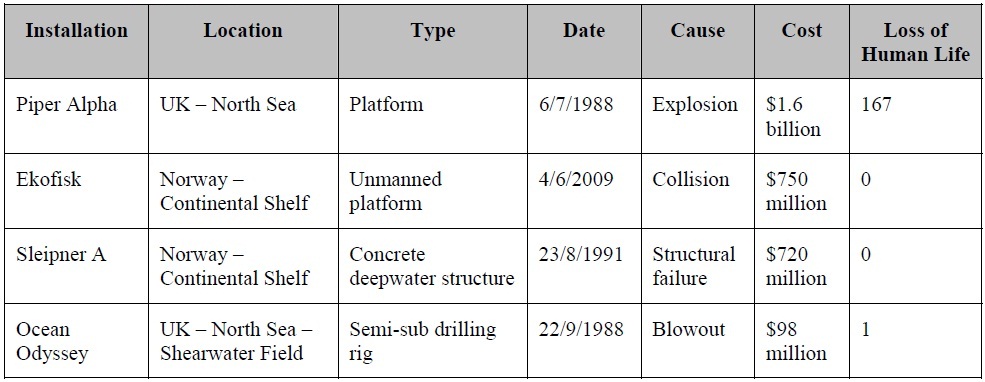
Statistically, the vast majority of reported major accidents in Europe do not result in significant spillages of oil, certainly not at a scale similar to the Gulf of Mexico disaster.In spite of this, the loss of life and/or damage to infrastructure resulting from the most common major accidents – helicopter crashes, explosions, collisions and capsizes – can be very significant. In these cases, the costs are borne by the operator and its insurer, and principally include asset loss, salvage and repair operations and compensation claims. Case histories of such accidents indicate that these costs sometimes run into hundreds of millions of euros, and may exceed €1 billion depending on their severity and the extent of damage, as demonstrated.
In cases where there is a significant release of oil and/or gas, additional major costs derive from clean-up and removal costs, impairment of natural resources and correlated economic activities, potential fines or penalties, as well as legal liabilities to third parties, e.g. for loss of earnings in the fishing and tourism sectors. The Deepwater Horizon disaster has demonstrated that these costs can be many times that of the loss of infrastructure, particularly in the case of incidents known as blowouts15, where formation fluid flows out of the well or between formation layers after all the predefined technical well barriers or the activation of the same have failed.
Insurance companies consider that, in the offshore sector, blowouts carry the biggest risk in terms of the extent of damage. This is because of the potentially great spill volumes involved in such incidents – one significant reference point for assessing the costs of an offshore incident. While oil spills can also occur as a result of other types of incidents (e.g. collisions, pipeline ruptures), the overall amount of oil released in those cases is likely to be limited. In the case of a blowout, however, oil may be released at a high rate for weeks, or even months, until either successful intervention stops the flow of oil or pressure within the oil reservoir diminishes sufficiently. Because of this, the reinsurer Munich RE proposed in September 2010 a mechanism that would allow the global insurance and reinsurance industry to provide Gulf of Mexico operators with up to a US$20 billion cushion for specialized drilling operations; significantly more than the US$1-1.5 billion limit that covers on the international insurance market are generally subject to. Historical data show that the two largest accidental oil spills at sea have been caused by blowouts. The 10 largest accidental oil spills in the last 50 years:
- Deepwater Horizon – United States, 2010 – Type: Blowout – Spill (tonnes): 666,400
- Ixtoc 1 -Mexico, 1979 – Type: Blowout – Spill (tonnes): 476,000
- Atlantic Empress -Trinidad and Tobago, Barbados, 1979 – Type: Tanker – Spill (tonnes): 287,000
- Nowruz Oil Field – Iran, 1983 – Type: Blowout – Spill (tonnes): 272,000
- ABT Summer – Angola, 1991 – Type: Tanker – Spill (tonnes): 260,000
- Castillo de Bellver – South Africa, 1983 – Type: Tanker – Spill (tonnes): 252,000
- Amoco Cadiz – France, 1978 – Type: Tanker – Spill (tonnes): 223,000
- Haven – Italy, 1991 – Type: Tanker – Spill (tonnes): 144,000
- Odyssey – Canada, 1988 – Type: Tanker – Spill (tonnes): 132,000
- Torrey – Canyon UK, 1967 – Type: Tanker – Spill (tonnes): 119,000
The largest oil spill in Europe resulting from offshore oil activities probably occurred on the Ekofisk Bravo platform in Norwegian waters. As a result of a blowout in April 1977, an estimated 80,000–126,000 barrels of oil (about 2% of the Deepwater Horizon spill) was discharged during the course of a week before the leak was stopped. Rough seas and higher than average air temperatures aided the break up of much of the spilled oil, and as a result no major ecological damage resulted.
Given the low frequency of major oil spillages from offshore facilities in Europe, another way of estimating the financial cost of potential spills is to use figures from tanker spills as a proxy for such accidents, mindful of some qualifications. There have been several such disasters in the European maritime transport sector which demonstrated the potential consequences of an oil spill. The sinking of the Erika and the Prestige tankers in 1999 and in 2002, respectively, triggered new EU-legislation as regard to maritime transport.
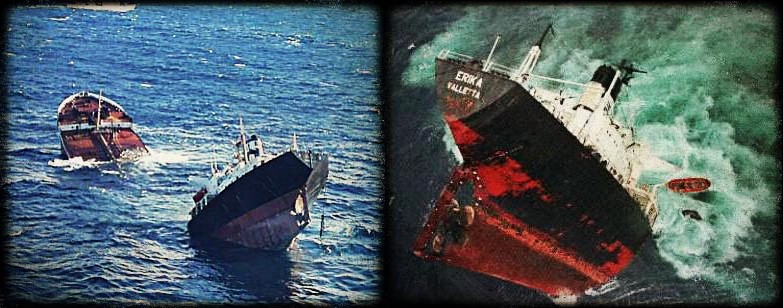
Although the volumes spilled were much lower than in the case of the Deepwater Horizon, the Erika and Prestige accidents are considered the greatest environmental disasters to ever hit France and Spain, respectively.
- In case of the Erika, about 19,000 tonnes of the 30,000 tonnes of heavy fuel it was carrying were spilled. About 400 kilometres of coastline were polluted, causing serious damage to marine and bird life, fisheries and tourism. In 2000, these damages were valued at € 400 million.23
- In case of the Prestige tanker, it is thought that more than 80% of its 77,000 tonne load of fuel oil was released into the sea. The oil spill polluted thousands of kilometres of Spanish and French coastline, as well as causing great harm to the local fishing industry. According to some estimates, the damages amounted to over € 5 billion.
Because more comprehensive data exist for tanker spills, studies have used these data to propose an indicative cost per unit of oil spilled – an exercise that addresses the analysis skewing effects of concentrating on a select few high-profile cases. In March 2010, the International Maritime Organization’s Marine Environment Protection Committee considered independent statistical studies by Greece, Japan and Norway on global oil spill compensation data. These studies showed very similar non-linear functions of total spill cost versus spill weight, obtained by regression. The body decided to use the formula proposed by Greece as its basis for their volume-dependent calculations of spill costs.
Care must be taken when using compensation costs as a proxy for the true economic cost of an oil spill because the scope of the compensation regimes and the admissible claims are not
all-inclusive (for example, they may exclude long-term damage to ecosystems), and the total amount of compensation is capped. Formulae derived from such data therefore underestimate true spill costs. Using the IMO formula 51,432*V*0.7 (V = spill weight (tonnes)), the costs of the Deepwater Horizon oil spill would be just over US$893 million, a figure around 45 times smaller than the costs estimated by BP.
The above illustrates how the experience of previous tanker oil spills can lead to the underestimation of the costs associated with the Deepwater Horizon disaster. This is because existing conventions stipulate that compensation is only payable for the costs of “reasonable” measures taken to combat oil at sea and to protect resources vulnerable to oil. However, major and long-lasting oil spills often give rise to strong public reactions putting the government and other public authorities responsible for spill response under considerable pressure to intervene. Offshore blowouts pose the greatest risk in terms of sheer spill volume, and influences such as the above were unquestionably in operation during the months the Deepwater Horizon disaster lasted. Should a comparable blowout occur in European waters, it can be expected that similar public sentiments and political pressures would drive up the ultimate costs of cleanup and compensation. This view is reinforced by the UK House of Commons conclusion that: “Given the high costs of the incident in the Gulf of Mexico, we believe that the OPOL (Offshore Pollution Liability Association) limit of $250 million is insufficient.
Given the shortcomings of the IMO formula, an alternative source on spill costs can be found in a study by Dagmar Etkin. This sought to approximate per-unit marine oil spill clean-up costs in different geographic locations by examining historical data. In general, spills in more-developed nations with high labour costs, complex regulations for spill response and high standards for environmental protection were found to be more expensive.
A final source on the potential costs of a blowout in Europe is environmental reports from the offshore industry itself. In February 2011, the environmental statement of the US oil company Hess, seeking to drill a deepwater well off Shetland, received much publicity. In the worst case scenario identified by the document, more than 4 million barrels (550,000 tonnes) of oil could spill into the sea over a period of just over 2.5 months and spread as far as Iceland, Ireland, Norway, the Netherlands and the northeast coast of England. The document also suggests that because of the weather conditions (wind, waves, currents) “surface containment and recovery equipment are unlikely to be effective”. We can combine the spill volumes in this scenario with the per-unit marine oil spill clean-up costs to estimate the costs of an accident in Europe.
In the event of a subsea blowout whereby the blowout preventer has failed and oil is freely flowing into the sea, Hess estimates it may take “considerably longer than 1 week” to install a cap that would stop the flow from the well. Assuming this intervention takes 10 days, is successful, and a steady release rate of 88,000 barrels (12,005 tonnes) of oil per day is maintained until the spill is capped, the figures from the Etkin study (mentioned above) estimate that the spill would result in US$ 1.4 billion in clean-up costs. In Hess’ worst case scenario of a 2.5 month, 550,000 tonne release, the spill would cost US$ 6.6 billion to clean-up, according to this same formula. This supposes that the spill affects the UK, Norway and the Netherlands equally. It is to be emphasized, again, that these figures are only for clean-up costs and do not include third party liabilities nor other potentially substantial economic costs. In the case of Deepwater Horizon, BP estimated such additional costs to be around twice the clean-up costs incurred.
In conclusion, the evidence shows that it is very difficult to generalize about the economic costs of offshore accidents. Nevertheless, for the purposes of this study we can assume that the average property damage cost of a major accident is €50 million. In the case of large blowouts in European waters (over 500,000 tonnes), we can assume that directly quantifiable costs for cleanup and compensation will be between €5 billion and €30 billion. This range is estimated using the cleanup-only cost calculations in the paragraph above as a lower bound, and BP-estimated Deepwater Horizon costs as an upper bound. It does not include indirect costs such as the effect on oil prices, the health of the oil industry, or security of energy supply. Although unquantifiable, these costs could also be very significant. They should, therefore, also be factored into any costbenefit analysis of policies aimed at improving offshore safety, albeit qualitatively.
Additional information regarding the safety on offshore oil & gas platforms can be found in the link below where a series of documents are available as part of the EU work in developing “Offshore oil & gas platforms standards”.
Source: European Commission Offshore oil & gas platforms standards


Leave a Comment