Last April PSA Norway released its annual report on trends in risk level on the Norwegian shelf (project started in the year 2000). The objective of this annual report is to measure the impact of the industry’s HSE work, to identify any areas that are critical to HSE and to increase insight into potential causes of accidents. In this post we present the results of the report regarding work accidents involving fatalities and serious personnel injuries.

For 2012, the PSA registered 336 personnel injuries on facilities in the petroleum activities on the Norwegian shelf that fulfill the criteria fatality, absence into the next shift or medical treatment. In 2011, 335 personnel injuries were reported, thus the figures between 2011 and 2012 remain the same. There were no fatal accidents in the PSA’s area of authority on the shelf in 2012. In addition to the above:
- 39 injuries were classified as off-work injuries in 2012 whereas the number for 2011 was 65.
- 51 as first aid injuries in 2012 whereas the number for 2011 was 105.
In recent years, there has been a clear reduction in the number of reported injuries on NAV (Norwegian Labour and Welfare Administration) forms. In 2012, a total of 36 % of the injuries were not reported to the PSA on NAV forms, but were registered based on information received in connection with quality-assurance of data. The injuries not reported on NAV forms also include serious injuries.
On production facilities there was a clear, steady decline during the period from 2002 to 2004, from 18.2 to 11.3 injuries per million working hours in 2004. From 2004 to 2008, the overall injury frequency was generally unchanged, around 11 injuries per million working hours. In 2009, there was a significant decline from 11 to 8.6 injuries per million working hours. This positive development continued from 2009 to 2010. In 2011 and 2012, the injury frequency was 7.8 per million working hours.
On the mobile facilities, in the same way as for production facilities, there has been a positive development over the last ten years; from 2002, the frequency steadily declined from 15.8 to 11.1 in 2006. I 2007, there was an increase in injury frequency, but since 2008, there has been a positive development and 2010 has the lowest registered frequency in the entire period. However, in 2011 the frequency increased again, from 5.8 in 2010 to 7.0 per million working hours in 2011. Last year saw positive development again, and the injury frequency in 2012 was 6.6 injuries per million working hours. In 2012, there were 90 injuries on mobile facilities, compared with 93 in 2011.
Regarding serious personnel injuries, production facilities, the frequency exhibited a downward trend from 2002 to 2004. Starting in 2005, there was a positive trend until 2008, when the positive development reversed. In 2009, there was a temporary decline, followed by a positive trend in recent years, and in 2012, the injury frequency on production facilities reached its lowest level ever. In recent years, there has been a reduction in the injury frequency on production facilities of 0.11 injuries per million working hours. The injury frequency has declined from 0.55 in 2011 to 0.44 in 2012. As regards production facilities, there was a significant reduction in both 2011 and 2012, compared with the previous ten-year period. There were 14 serious injuries on production facilities in 2012, compared with 17 in 2011. The number of working hours has increased by 0.5 million hours, from 31.18 million in 2011 to 31.65 million in 2012.
The figure below shows the frequency of serious personnel injuries on production facilities per million working hours.

Regarding serious personnel injuries, mobile facilities, over the long term, there has been a clear decline in recent years from the peak in 2002. The development during the period from 2002 to 2006 was characterised by minor changes in injury frequency, whereas in 2007, there was a more marked reduction. In 2008, there was another decline in the frequency, but the subsequent two years are characterised by a very positive development, and in 2010, the frequency was the lowest level ever recorded. In 2012, there was a reduction in the frequency of serious personnel injuries of 0.2 injuries per million working hours, from 0.83 in 2011 to 0.66 in 2012. The injury frequency is within the expected value, based on the previous ten years. The number of hours reported for mobile facilities in 2012 had increased by 0.5 million, from 13.2 to 13.7 million. The number of serious personnel injuries in 2012 was 9, compared with 11 in 2011.
The figure below shows the frequency of serious personnel injuries per million working hours on mobile facilities.
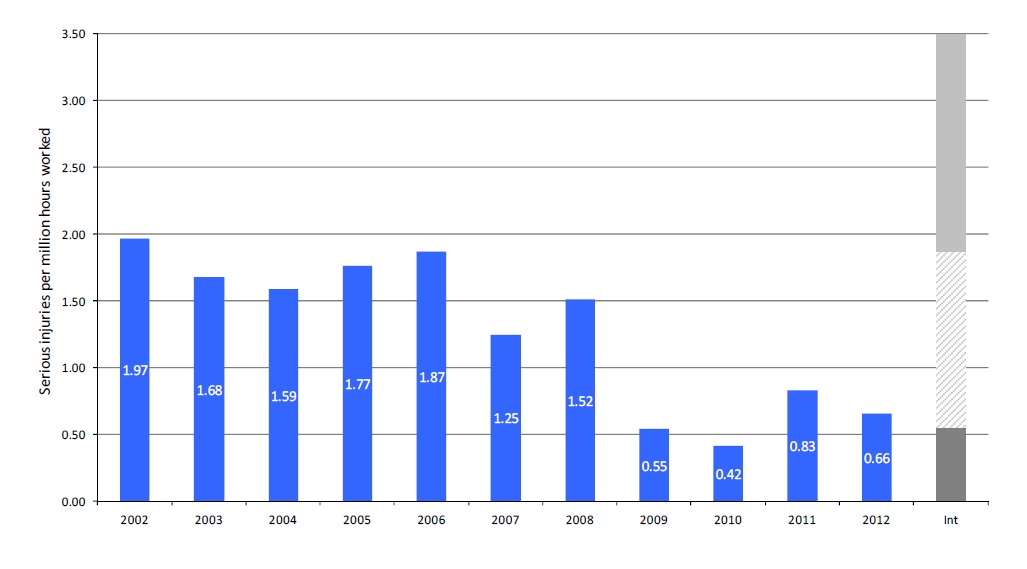
By making comparison of accident statistics between the UK and Norwegian shelves the calculation of the average injury frequency for fatalities and serious injuries for the period from 2007 up to the 1st half of 2012 shows that there have been 0.65 injuries per million working hours on the Norwegian shelf and 0.73 on the UK shelf. The difference is not significant. The average frequency for fatalities on UK shelf is 0.97 per 100 million working hours, compared with 0.89 on the Norwegian shelf. This difference is also not significant. On the UK shelf, there were three fatalities during the mentioned period, compared with two on the Norwegian shelf.
Source: PSA Norway


Leave a Comment