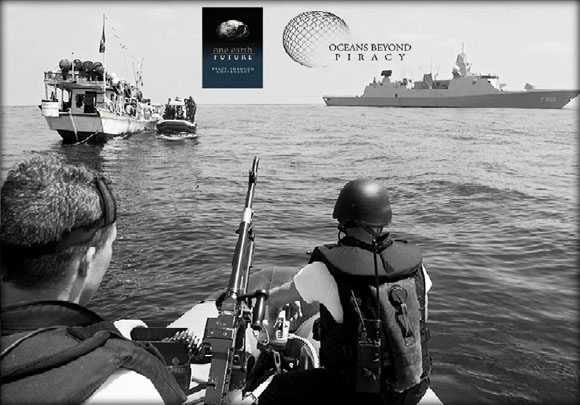
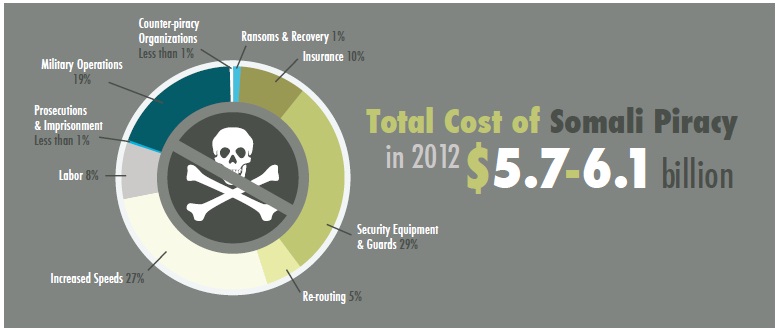
Oceans Beyond Piracy (OBP), a project of the One Earth Future foundation (OEF) has published a few months ago its third annual assessment of the Economic Cost of Somali Piracy for 2012 (ECoP 2012). This year’s assessment, like the one before it, considered nine separate, first order cost categories and found that maritime piracy cost the global economy between $5.7 and $6.1 billion in 2012. This estimate is the result of extensive research, supplemented by contributions from and an extensive audit by independent piracy experts. At between$5.7 and $6.1 billion, the cost of piracy to the global community fell by around $850 million, or 12.6% from 2011.
While 2011 was characterized by a sharp drop in Somalia-based piracy attacks and hijackings at mid-year, 2012 was marked by the continuation of consistent policies to successfully repress piracy at sea. These policies include a largely stable naval presence, supported by the continuation of existing political mandates from the coalition forces. While a more aggressive posture was adopted by the coalition navies, including the first strike on land, the costs associated with the naval presence were estimated to be similar to those incurred last year. The maritime industry’s collective response to piracy was marked by a continuation of recommended practices in line with the 4th Revision of the Best Management Practices (BMP4), which were adopted in August 2011. The High Risk Area associated with the latest version of BMP also remained consistent throughout the year, which reflected the assessment that the range of Somalia-based pirate attacks had finally reached their zenith. A final factor leading to the drop in Somali piracy in 2012 was the increased presence of armed guards. In 2011, OBP estimated that around 30% of ships employed private armed security. In 2012 that percentage was revised upwards to 50%. Finally, the analysis of Automatic Information System (AIS) data has caused us to revise our estimates of large-scale commercial shipping traffic in the Indian Ocean from 42,450 vessel transits to 66,612 transits per year.
As mentioned above, the cost of piracy dropped by about 12.6% since 2011. However, this moderate figure, combined with the significant drop of reported piracy attacks in the 2012, means that the “per incident” cost to the international community has risen dramatically.
There were several significant cost observations for 2012, as compared to those incurred during 2011:
- Increased “per incident” costs: Between 2011 and 2012, the number of attempts and hijackings fell much more drastically than the cost of combatting piracy. This led to a substantial increase in the “per incident” cost of piracy. In 2011, $28.6 million was spent per pirate attack, and in 2012, that number rose 189.0% to $82.7 million.
- Increased cost of armed guards: The most pronounced increase in the cost of piracy came as a result of the increased number of armed guards used to protect merchant vessels transiting the HRA. Between $1.15 and $1.53 billion was spent on armed guards in 2012. In 2011, that figure was $530.6 million. The observed increase comes as the result of an increased proportion of ships employing armed guards (30% in 2011 and at least 50% in 2012) as well as a revised estimate of the number of commercial transits through the HRA each year. Controlling for that latter methodological factor, the cost of armed guards increased 79.7% in 2012.
- Decreased cost of increased speeds: The most drastic cost reduction seen in 2012 came from a decrease in the cost of fast steaming through the HRA. In 2011, an estimated $2.7 billion was spent on above optimal speeds, but that figure was down to $1.53 billion in 2012. The observed $1.17 billion dollar decrease comes from a decline in the proportion of ships steaming at above optimal speeds as well as a reduction in the amount by which the average “speeding” ship steamed above the economically optimal level. These estimates were made using Satellite AIS data, which was analyzed to calculate this year’s cost and assess last year’s figures.
- Consistent ratio of Recurring Costs vs. Investment: In 2011, it was estimated that approximately 99.5% of the total cost of piracy was spent on the recurring costs of vessel protection. This figure stood in stark contrast to the money invested in prosecutions and building regional and Somali capacity to reduce piracy. In spite of the success achieved at sea in reducing piracy attacks and hijackings, this ratio remains consistent with last year’s figures. In 2012, 99.4% of all funds were spent on recurring suppression costs, with the remaining 0.6% invested in long-term prevention solutions.
What follows is a brief summary of the findings from each of the nine cost categories considered:
- Ransoms and Recovery: In 2012, OBP estimates that $31.75 million dollars in ransoms were paid to Somali pirates. This represents an 80.1% decline in ransoms paid from 2011, when $159.62 million was paid. The reduction in ransoms is due to the lower number of vessels captured and released in 2012, as well as a lower average ransom than the previous year. In addition to the ransom payment itself, the logistical costs associated with paying ransoms and recovering the vessels – including the cost of delivering the ransom, damage caused to the vessel while it is held, and the cost of negotiators, consultants and attorneys’ fees – were estimated at 100% of the value of the ransoms themselves, bringing the total cost attributable to the payment of ransoms and recovery of vessels to $63.5 million in 2012.
- Military Operations: The incremental cost of vessel deployments (including reconnaissance aircraft and Unmanned Aerial Vehicles), vessel protection detachments, the administrative budgets of naval operations, and SHADE (Shared Awareness and Deconfliction) meetings amounted to $1.09 billion in 2012. This figure represents a 14% decrease from the $1.27 billion reported in 2011. However, most of the decrease comes as a result of a more conservative methodology used to calculate the cost of UAV deployments. Operationally, the major change that took place between 2011 and 2012 is a decrease in naval assets deployed by the “big three” naval missions – EUNAVFOR’s Operation Atalanta, NATO’s Operation Ocean Shield, and the Combined Task Force’s CTF-151 – alongside a corresponding increase in the assets provided by “independent deployers” including China, India, Japan, Russia, and South Korea.
- Security equipment and guards: The total cost of security equipment and guards in 2012 was estimated to fall within the range of $1.65 and $2.06 billion. The cost of security equipment fell a moderate 11%, from around $578.7 million in 2011 to $514.6 million in 2012. Because of a greater acceptance of armed guards by both Flag States and ship owners and operators, the cost of armed guards rose much more dramatically, up 79.7% from 2011 to 2012 when keeping the number of annual transits through the Indian Ocean constant. However, our revised estimate of annual transits resulted in a more dramatic increase, with between $1.15 and $1.53 billion spent on armed guards alone in 2012.
- Re-routing: Shipping companies spent $290.5 million re-routing along the Arabian Peninsula and Indian coast as opposed to taking a direct route through the HRA. While Best Management Practices still recommends that vessels re-route, it appears as though fewer ship owners and operators are actually doing so. The sum spent on re-routing is down 47.9% from the amount estimated in 2011. However, the proportion of ships transiting around the Horn of Africa that chose to re-route only dropped by 10%. The rest of the reduction is the result of a change in methodology, whereby fewer tankers and bulk carriers were considered to be candidates for re-routing.
- Increased speed: In 2012, OBP estimates that shipping companies spent an extra $1.53 billion on fuel costs associated with steaming at faster than optimal speeds in order to prevent pirate attacks. While there was no change in the industry’s recommendations for increased speed through the HRA, the estimated cost of this practice dropped 43.3% from 2011, where the estimated additional cost was $2.7 billion. This $1.17 billion decrease is the largest in absolute terms of all nine cost sections considered, and is the result of a reduction in the proportion of ships going through the High Risk Area at increased speed and a drop in the average speed of those ships steaming at faster than optimal speeds. To calculate the cost of increased speed for 2012, and to confirm the drop in compliance, OBP utilized satellite Automatic Information System (AIS) data provided by ExactEarth™ and licensed to OBP for use in this report.
- Labor: The labor-related costs attributable to maritime piracy include the cost of hazard pay as well as the cost of paying seafarers while a vessel is being held hostage. Hazard pay is associated with the International Bargaining Forum agreement, which affords crews on participating vessels the right to double pay while transiting the High Risk Area. These costs totaled $471.6 million, up significantly from the $195.1 million estimated in 2011. This increase is the result of a revised estimate that 70% of seafarers transiting the HRA are entitled to hazard pay, based on IBF membership or similar arrangements, as opposed to the 30% assumed in 2011. This revised assumption came as the result of conversations with the Anglo-Eastern Group, a leading ship management company. Hazard pay is also affected by the revised estimate of annual transits in the Indian Ocean. Thus all of the observed labor cost increases come as a result of revised methodology as opposed to changes in labor practices.
- Prosecutions and imprisonment: In 2012, the cost of prosecution and imprisonment was $14.89 million, down 9.2% from the figure reported in 2011. Broken down further, the cost of prosecutions was $8.84 million, down 24% from 2011, while the cost of imprisonment increased 26.67% from 2011 to $6.04 million in 2012. The reduction in prosecution costs appears to be almost entirely due to a decrease in the number of suspects prosecuted, while the increase in the cost of imprisonment reflects the long term obligations associated with imprisoning a pirate. More new pirates were imprisoned in 2012 than were released.
- Insurance: The cost of insurance fell by 13.3%, from $634.9 million spent in 2011 to $550.7 million spent in 2012. This fall is attributable to the increased presence of private armed guards aboard merchant vessels and the resulting premium discount. Moreover, due to a higher number of expensive vessels transiting the Suez Canal in 2012, the costs associated with War Risk premiums rose slightly. Controlling for that change in the composition of the insured property, the cost of piracy-related insurance fell by 14.9%.
- Counter-piracy organizations: The cost of various counter-piracy organizations, ranging from United Nations agencies to independent NGOs, was $24.08 million in 2012. This figure represents a 13% increase from the $21.3 million reported in ECoP 2011. The organizations included in this section are the Trust Fund to Support Initiatives of States to Counter Piracy off the Coast of Somalia, the United Nations Office of Drugs and Crime (UNODC), the Contact Group on Piracy off the Coast of Somalia (CGCPS), the Djibouti Code of Conduct, the United Nations Development Programme – Somalia, EUCAP NESTOR, Regional Anti-Piracy Prosecution & Intelligence Coordination Centre (RAPPICC), the PiraT Project, and OBP.
It is worth mentioning that the report’s calculations have been audited by BIMCO a fact that hihghlights the quality of the work done by the following individuals:
- Lead Author: Jonathan Bellish
- ECoP Research Team: Thaddeus Cummins, Anjuli Manrique, Timothy Schommer
- OBP Team: Jim Gray, Liza Kane-Hartnett, Jon Huggins, Kaija Hurlburt, Jens Vestergaard Madsen, Maisie Pigeon, Urmila Venugopalan
The executive summary of the OBP Report “Economic Cost of Somali Piracy for 2012” is reproduced here with the author’s kind permission.
Source: Oceans Beyond Piracy


Leave a Comment